Timeframe
WiSE can calculate on the chart bars or on a different bar series. You pick the series here, so you do not have to add it to the chart first.
- Calculate on — Chart (the default) uses the chart bars. Custom uses the bar series set below. Signals, targets and zigzags are still drawn on the chart bars: each symbol sits on the chart bar inside the custom bar where its high or low happened.
- Bar type — the type of the custom series: Tick, Volume, Range, Second or Minute. Shows only when Calculate on is Custom.
- Bar value — the size of the custom series, for example 10000 for 10000 tick bars (the default). Shows only when Calculate on is Custom.
With Custom, the signal plots update on the first chart bar after the custom bar closes, and BarsAgo counts chart bars. Custom works on a chart only. When a strategy or another script runs WiSE, WiSE calculates on its own bars and writes a warning to the NinjaTrader log.
Parameters
- Display Symbols — toggles the display of symbols on the chart.
- Dual Break Entry Index — the entry index from which all subsequent entries require two breaks.
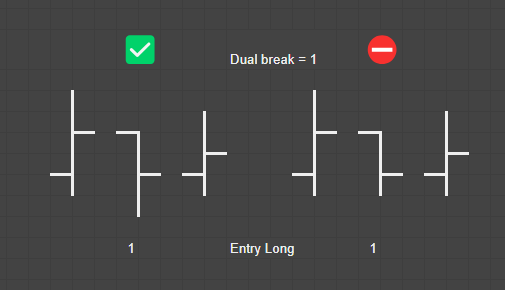
- Reset on Double Top/Bottom — treats Double Top and Double Bottom patterns as New High and New Low.
- Use engulfing bars — On by default. Before a second entry long counts, a bar must break the prior bar's low (for a short, the prior bar's high). When On, one outside (engulfing) bar can do both jobs: it breaks the prior bar's low and it is also the new push that makes the second entry. WiSE marks that entry with an e. When Off, a separate bar must break the low first, and only a later push counts as the second entry. Off matches the rule taught in the first Wizdough video: the next push only counts after a bar takes out a low in between.
- Profit Target (ticks) — the number of ticks used to test second entries for success or failure. A second entry that achieves less than the profit target and then breaks the prior bar in the opposite direction is marked challenged (c); if it then breaks the implied stop behind the SE signal bar, it's marked failed (x).
- Require higher low (lower high for shorts) — Off by default. When On, a second entry counts only when its pullback holds above the first pullback (below it for shorts).
Filters
See Filtering Signals for full explanations and examples of every filter.
Symbols
Customize the symbol used for each signal type — a single letter, a group of letters, or even emoji (press Win + . to open the emoji picker). A few ideas:
- Minimalistic:
^~-+_|.; - Abbreviations:
2EL,SEL,F2EL - Emoji: ✌ 👍 ✔ ▼ ▲ ↓ ↑
Configurable symbols: New High, New Low, First Entry Long/Short, Second Entry Long/Short, Lower High, Higher Low, Failed Second Entry Long/Short, Challenged Second Entry Long/Short, Entry Followed by Inside Bar Long/Short, Engulfing Bar Long/Short.
Measured Move
These settings draw a measured move target (MM) at entries that are not filtered. See Measured move target for how the target is found. The rows below Show Measured Move show only when it is on.
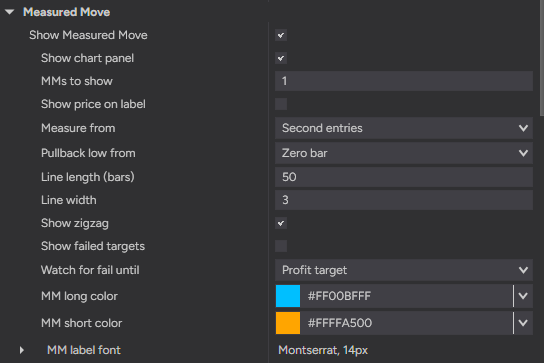
- Show Measured Move — Off by default. Off turns every measured move feature off: targets, zigzags, the chart panel and the fail watch until the target.
- Show chart panel — shows a small panel at the top left of the chart with these controls: MMs to show, Show price on label, From, Line length, Show zigzag and Show trend leg numbers. A change redraws the chart at once and is saved with the workspace. The button next to the panel title collapses it to a small WiSE MM tab, and the + button opens it again.


- MMs to show — how many of the latest targets to draw per side, from 1 to 50. Long and short targets are counted separately. Default 1. With Show failed targets Off, only targets that did not fail count. With it On, failed targets count too.
- Show price on label — adds the target price and the leg size to the label, for example
MM2 7702.75 (+19.00). Off showsMM2only. - Measure from — which entries get a target: Second entries (the default), First entries or Both. Targets from a second entry read MM2, targets from a first entry read MM1.
- Pullback low from — where WiSE starts to look for the pullback extreme. Zero bar (the default) includes the zero bar itself, as before. Bar after zero starts on the next bar.
- Line length (bars) — how many bars the target line runs, from 1 to 500. Default 50. The line stops earlier at the bar that touches the target. With Calculate on Custom, it counts bars of the custom series.
- Line width — the width of the target line, from 1 to 10. Default 2. The zigzag uses the same width, at least 2.
- Show zigzag — On by default. Draws how the target was found: leg start, zero, pullback and target.
- Show failed targets — Off by default. On draws the targets of failed entries in grey, and they count toward MMs to show. Off leaves them out.
- Watch for fail until — Profit target (the default) stops watching an entry for a fail after it moves Profit Target plus 2 ticks in its favor, as before. Measured move target or stop watches the entry until price reaches its target or the entry fails. Entries without a target still use Profit Target. With Show Measured Move off, it is always Profit target.
- MM long color / MM short color — the color of the line, zigzag and label for long and short targets. Default green and red.
- MM label font — the font of the MM labels.
Leg count
- Show trend leg numbers — Off by default. Puts Leg N over each zero (0). The first zero of a trend is Leg 1, and the count goes up by one after each counted pullback. It goes back to 1 after a lower low (a higher high in a down trend). This works with Show Measured Move on or off, and the chart panel has a checkbox for it.
- Legs to show — numbers legs 1 to N. Default 5. Higher legs read Leg N+.
Appearance
- Symbol padding — spacing between the symbols displayed on the chart.
- Long Entry Color / Short Entry Color — colors for long and short entry symbols.
- Hidden Color — the color for symbols hidden by your filters. Pick something dim, and check which signals were hidden to assess how effective your filters are.
- Unconfirmed Color — the color for predicted signals that haven't yet met all the criteria of a valid entry.
- Show all symbol state history — displays the entire history of symbol states on the chart.
Signals
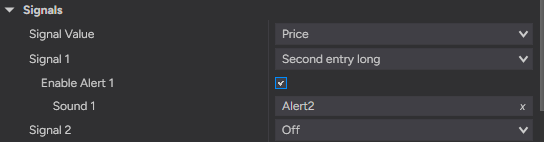
- Signal 1..12 — select which symbols to plot. Plotted signals can be used in alerts and third-party strategies. The lists use readable names, for example Second entry long or First entry long (predicted). Signal 1 always shows. Each next signal appears once the one before it is set.
- Enable Alert — under each Signal, toggles the alert for that signal. Shows once the signal is set.
- Sound — under each Enable Alert, assigns a sound to that alert. Shows once the alert is enabled.
Hidden rows
The settings window hides rows that do nothing with your current choices. A missing row is not a missing setting. Turn on the setting above it and the row comes back. For example, Symbols and Symbol padding show only with Display Symbols on, the engulfing bar symbols show only with Use engulfing bars on, and Bar type and Bar value show only when Calculate on is Custom.
Using WiSE in automated strategies
WiSE is designed for use in automated strategies (algo trading). It generates signal plots — FEL, FES, SEL, SES, HL, LH, plus predicted variants (FEL_predict, FES_predict, SEL_predict, SES_predict) — that your NinjaScript strategies can read directly.
Next: see what's new.
WiSE
Master the Art of Identifying Second Entries. $25/mo · 7-day free trial.