TimeScope is an indicator for NinjaTrader 8. It shades clock windows such as the Europe open, writes the buy and sell balance of the last US hour, shows how far each hour moved over the last 20 sessions, and counts down to the US close. It is free with a Wizdough account. See the TimeScope product page for what it draws.
Requirements
TimeScope runs on NinjaTrader 8. Install it before you begin. You also need a free Wizdough account with a confirmed email.
Three parts need more from your chart:
- Hourly stats need at least 5 past sessions on the chart. Right click the chart, open Data Series and set Days to load to 30. With fewer days, each hour row shows "n/a" and how many sessions it has.
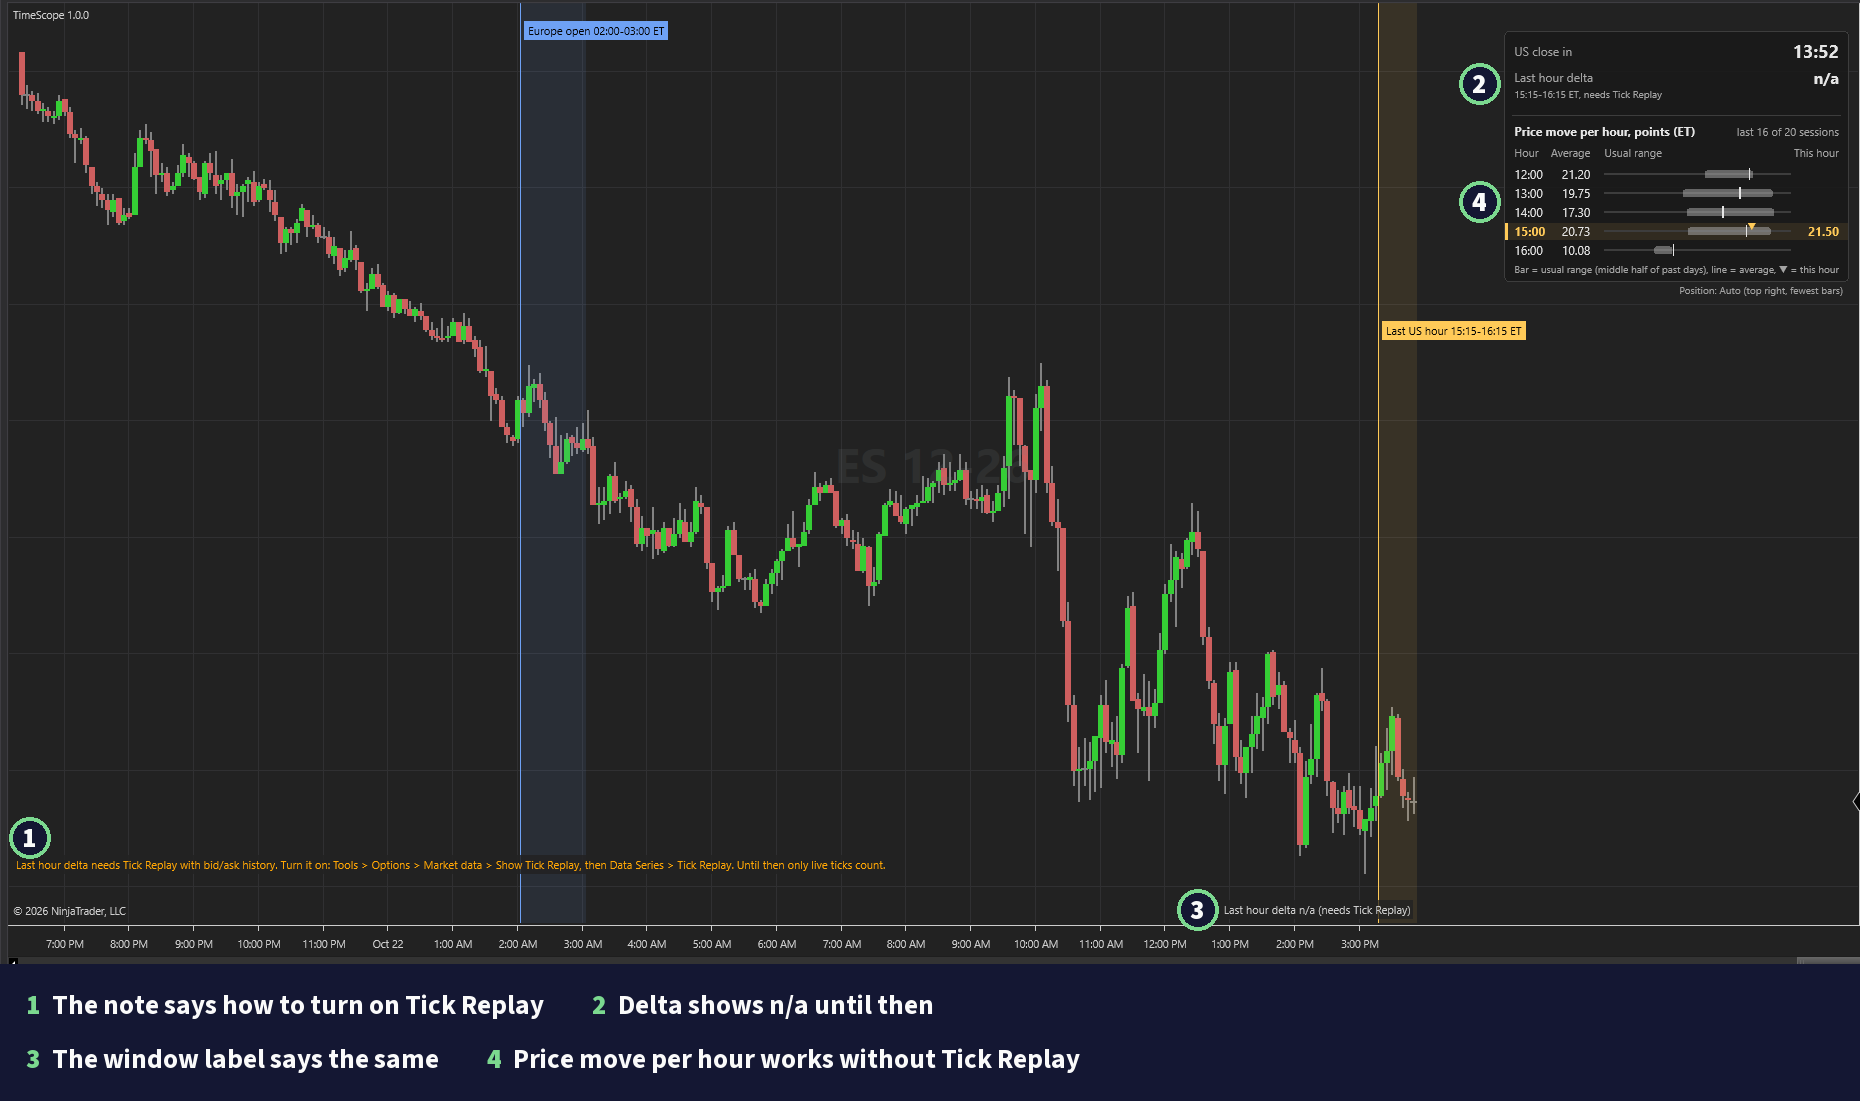
- Last hour delta needs Tick Replay with bid and ask history for past days. Without it, only live ticks count. If your data feed sends no bid and ask history, TimeScope uses the tick rule and says so on the label.
- Time ranges outside the US day session, such as the Europe open, need a 24 hour (ETH) Trading Hours template. On a day session template those windows have no bars, and the chart says so.
Install or update
- Sign in or create a free account, and confirm your email. Then open the TimeScope download page and click Download TimeScope. Your free license is made for the email of your account.
- In NinjaTrader's Control Center, open Tools → Import → NinjaScript Add-On... (NinjaTrader add-on installation guide).
- Select the downloaded
.zipfile. If NinjaTrader asks whether to replace existing files, answer Yes every time. - Restart NinjaTrader when it asks you to.
To uninstall, go to Tools → Remove NinjaScript Assembly.
Turn on Tick Replay
Do this once in NinjaTrader, then once for each chart that shows the last hour delta.
- In the Control Center, open Tools → Options → Market data and tick Show Tick Replay.
- On the chart, open Data Series and tick Tick Replay. Pick a Trading Hours template that covers 24 hours, for example CME US Index Futures ETH.
- Click OK. A chart with Tick Replay loads more slowly, so keep its days to load short.
Add TimeScope to a chart
- Right click your chart and select Indicators.
- Find TimeScope in the indicator list, in the Wizdough folder.
- Click Add, then OK.
Turn on your license
The first time TimeScope loads on a chart, NinjaTrader opens its license window. It shows your Hardware ID and PC Name, and an Email box.
- Type the email of your Wizdough account in the Email box and click Activate. We email you a key.
- Copy the key into the Serial Key box and click Activate again.
Until the license is active, TimeScope draws nothing. Your free license covers one computer.
If you type an email that has no license yet, TimeScope runs as a 7 day trial and then stops. Trial ended? Create a free account at wizdough.com, download TimeScope once, and type that email in NinjaTrader.
What you see on the chart
All four parts are on for a new chart. Each one has its own switch in the settings. The Settings page lists every setting with its default.
- Time ranges: the Europe open (08:00 to 09:00 Central Europe) and the last US hour (15:15 to 16:15 New York) are shaded, each with a label in ET. Each window keeps its own time zone, so in the weeks when Europe and the US change their clocks on different dates, the Europe open sits one hour away from its usual ET time.
- Last hour delta: at 16:15 ET a label gives buy volume minus sell volume, divided by all volume of 15:15 to 16:15 ET, and the volume. "(so far)" means the hour still runs, "(partial)" means ticks are missing, and "(tick rule)" means the feed sent no bid and ask history.
- Hourly stats: a table called Price move per hour, points (ET), with one row per ET hour. Average is the average move of that hour over the last 20 sessions, Usual range is the middle half of past days, and This hour is the move so far. In the bar, the box is the usual range, the line is the average, and ▼ marks this hour. By default it shows the current hour, the 3 hours before it and the 1 after it.
- Countdown: the time left to the US close at 16:00 New York. In Playback it follows the Playback clock.
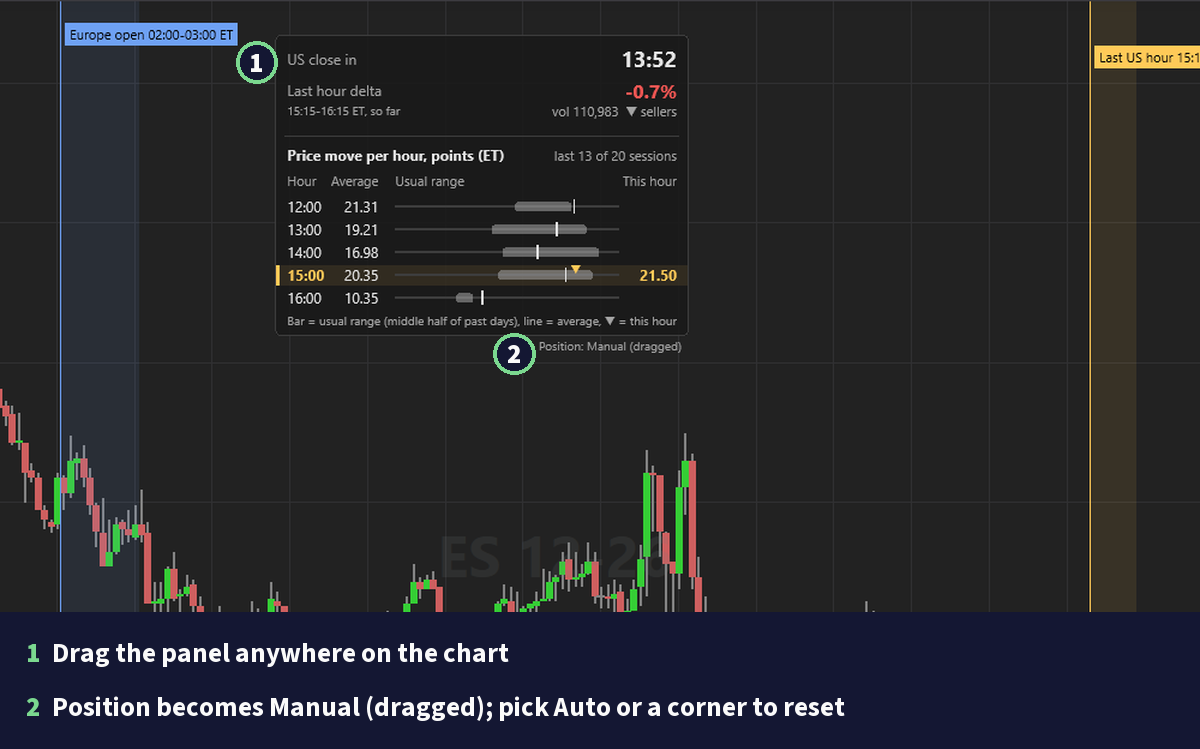
The countdown, the last hour delta and the hourly table sit together in one info panel. It goes to the chart corner with the fewest bars. Drag it to move it, and it stays where you drop it. To put it back, pick Auto or a corner in Position (Info panel group). Color theme in Appearance switches between Wizdough (the default), Classic and Cyberpunk.
The delta and the hourly stats describe what the market did. They are not a signal and not a forecast.

TimeScope
Time ranges, the last hour delta and hourly stats on your chart.. Free with a Wizdough account.