Trade MES Closer to ES 2000 Ticks
Tick Chart Compare for NinjaTrader 8 calculates and adjusts your chart interval to match a reference chart. Compare MES tick charts against ES 2000 ticks to find the closest match.
$49 · one-time purchase
- One-time purchase — no subscription
- 7-day money-back guarantee
- Works with any bar type
Built for the way you trade.
Match MES to ES structure
Compares bar counts between two instruments over a configurable time span and computes the tick interval that tracks your reference chart closest.
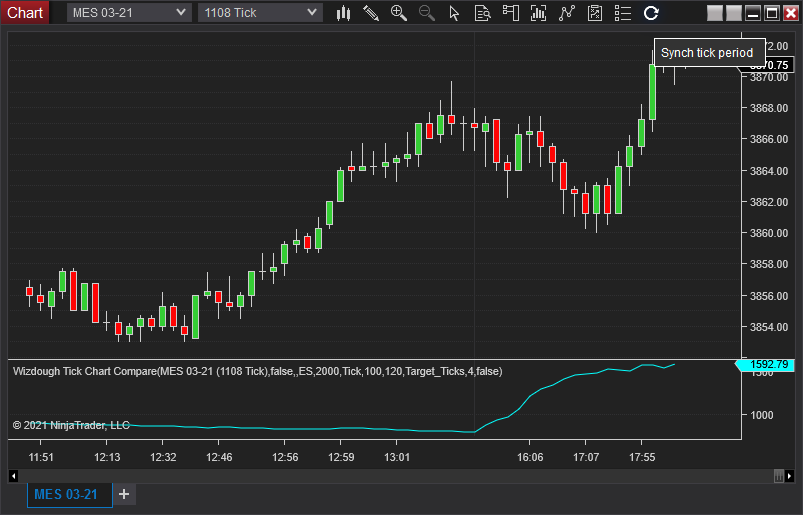
One click to sync
The Sync button changes your chart period to the calculated target instantly — no manual math, no re-opening chart settings.
Stable, not jumpy
A configurable smoothing period avoids unnecessary interval fluctuations, so your chart structure stays consistent through the session.
Features
- Compares bar counts between two instruments over a configurable time span
- Three output modes: Difference_Bars, Delta_Ticks, Target_Ticks
- One-click Sync button to change chart period to the calculated target
- Configurable smoothing period to avoid unnecessary fluctuations
- Works with any bar type (tick, minute, etc.)
- Configurable instrument and expiry for comparison
Indicator Overview
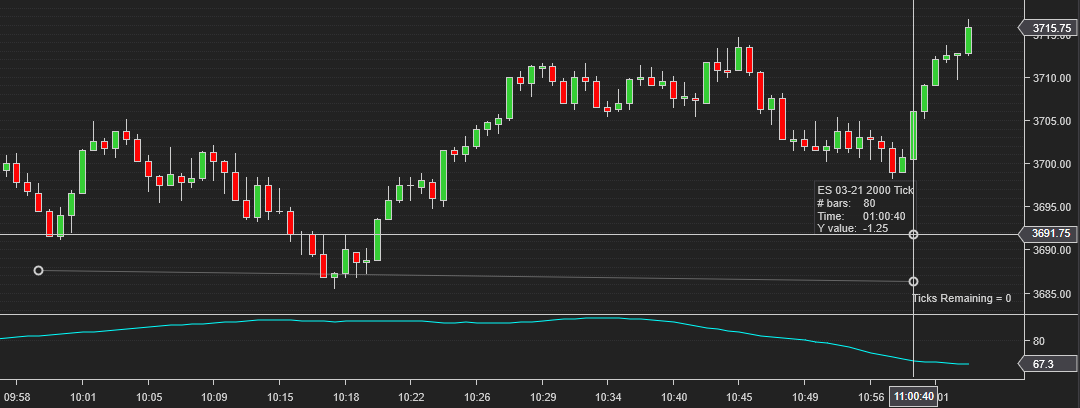
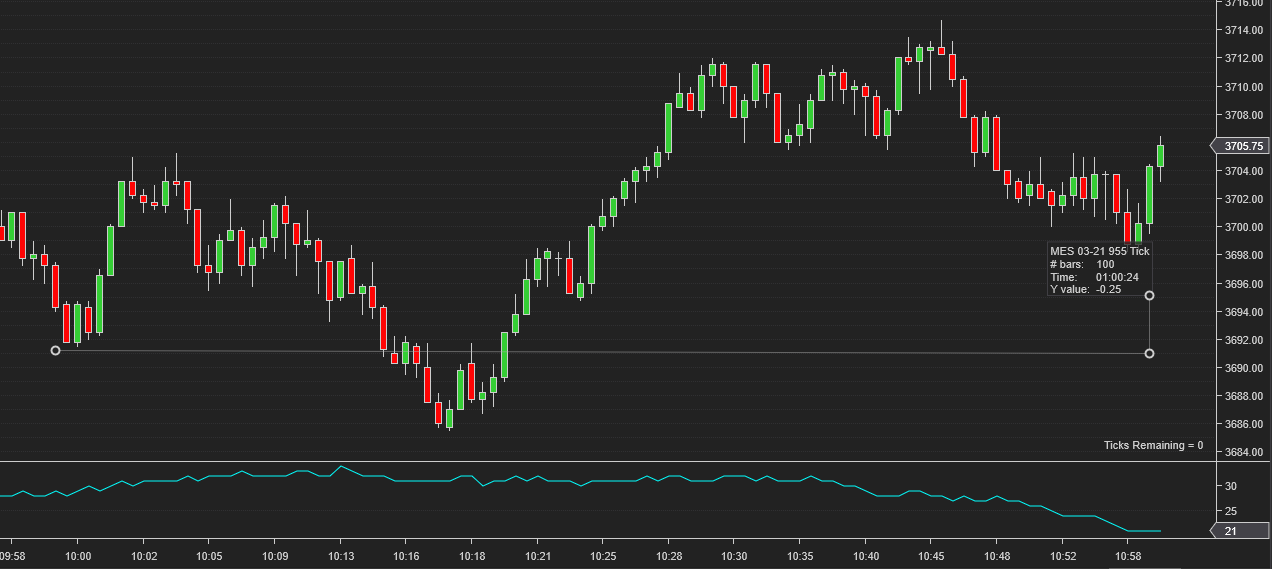
If you trade MES, you probably want your chart to match the ES 2000 tick chart as closely as possible. Finding the right tick count for MES is tricky — MES is not an exact copy of ES, and an MES 2000 tick chart will look very different from an ES 2000 tick chart. Some traders use 955 ticks, others pick 995. But why those numbers, and how do you know if yours is right?
Let's measure how many bars ES 2000 generated in the last 60 minutes and compare that to how many bars MES 955 produced in the same period. If the numbers are close, 955 works well. But more often than you'd expect, MES 955 doesn't match ES 2000 at all.
Wizdough Chart Sync Indicator lets you visualize this problem to make adjustments. The indicator calculates a target tick period for your MES chart by comparing how many bars each chart produced over a configurable time window.
Click the Sync button and the current chart period will change to the one calculated by the indicator.
Parameters
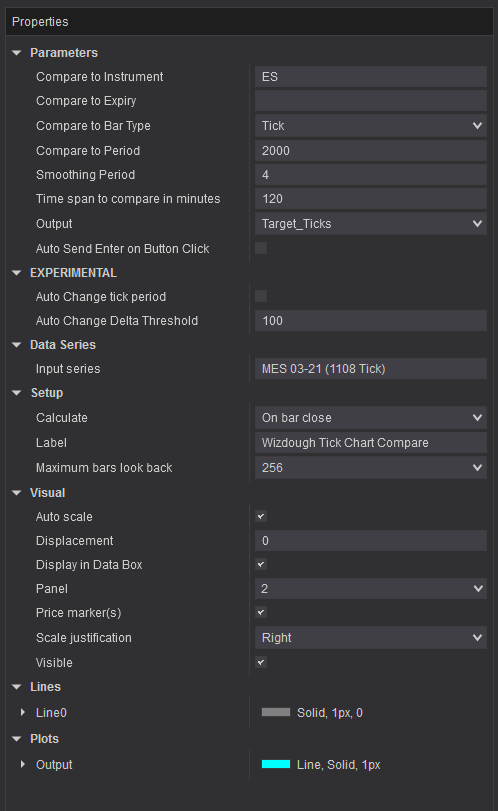
You can set which instrument to compare your current chart against. By default, expiry is empty, which means that your current chart's expiry will be used. You can compare any bar type — not just tick charts, but also minute, range, or other chart types. For example, compare MES 1200 ticks against MES 5 min.
The smoothing period helps to avoid unnecessary fluctuations if you want to keep your tick period more or less stable.
Timespan (minutes) sets how far back the indicator looks when counting bars.
Output can be one of these 3 options:
- Difference_Bars - after counting the number of bars of both charts we get this difference.
- Delta_Ticks - Difference_Bars in ticks. Basically, tells how much we should change the current tick period.
- Target_Ticks - Target_Ticks plus the current tick period. This value should be set as the target tick period.
Click the Sync button to apply the calculated tick period to your chart. Auto Send Enter - will also press "Enter" to submit the value.
- One-time purchase — no subscription
- 7-day money-back guarantee
- Works with any bar type
- Secure checkout via Stripe
Start trading with it this week.
$49
one-time purchase7-day money-back guarantee. If Tick Chart Compare isn't for you, contact us within 7 days of purchase for a full refund — see the Refund Policy.
By purchasing, you agree to our Terms, Software Agreement, and Risk Disclosure.
Already purchased? Download from your dashboard.
Requires NinjaTrader 8. Don't have it yet? Download it free — includes real-time futures data, advanced charting and a trade simulator. More on why we recommend it on our platform page.
Disclosure: Wizdough is a NinjaTrader vendor partner. Links on this page may be affiliate/referral links, and Wizdough may receive compensation for referrals.
Trading futures and forex involves substantial risk of loss and is not suitable for all investors. Past performance is not indicative of future results. See our full risk disclosure.
Tick Chart Compare
$49