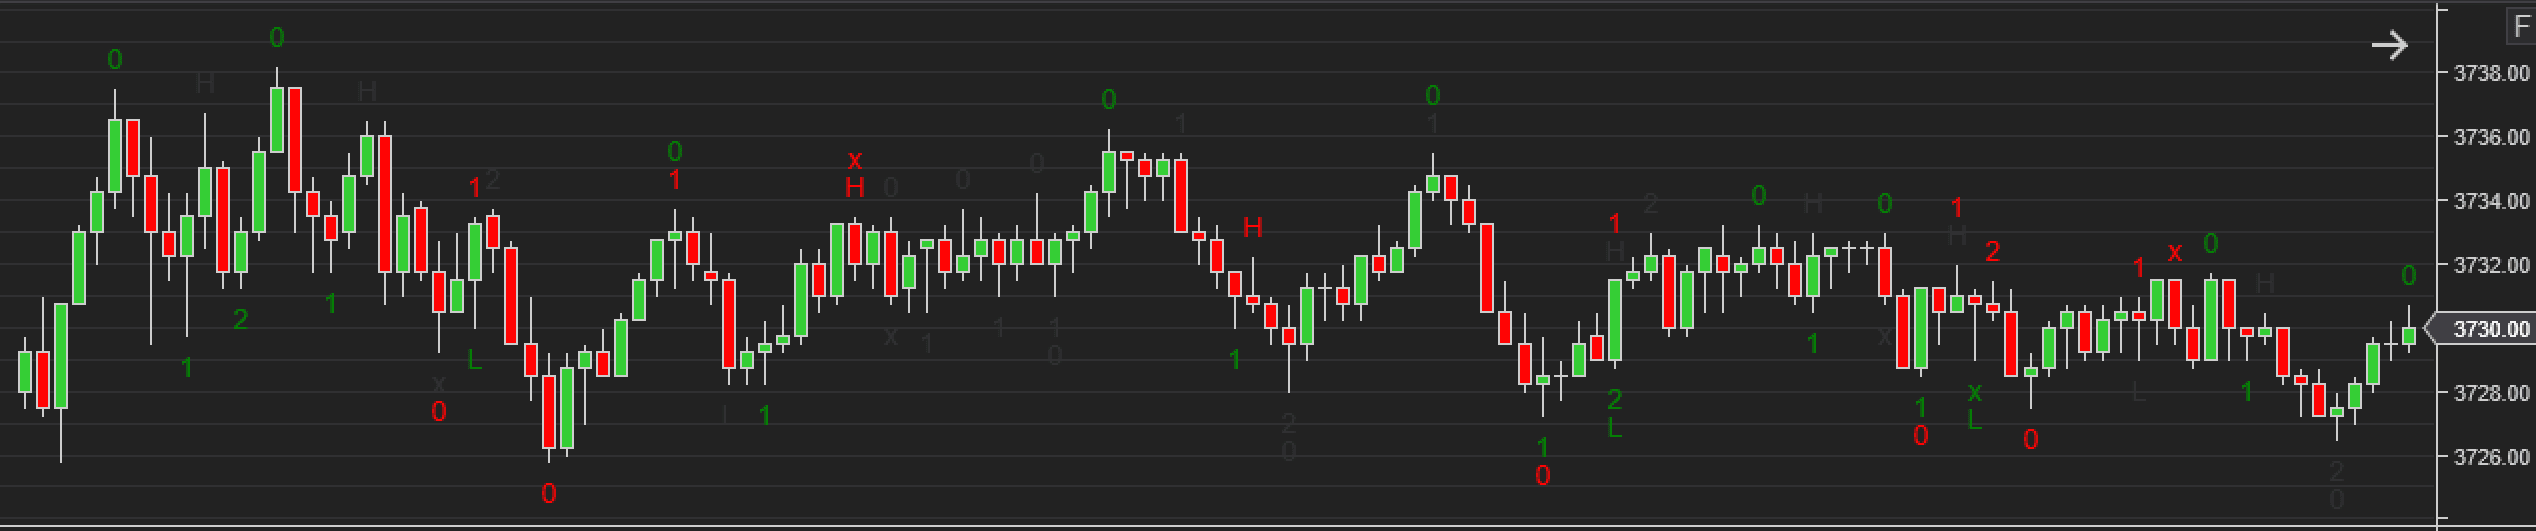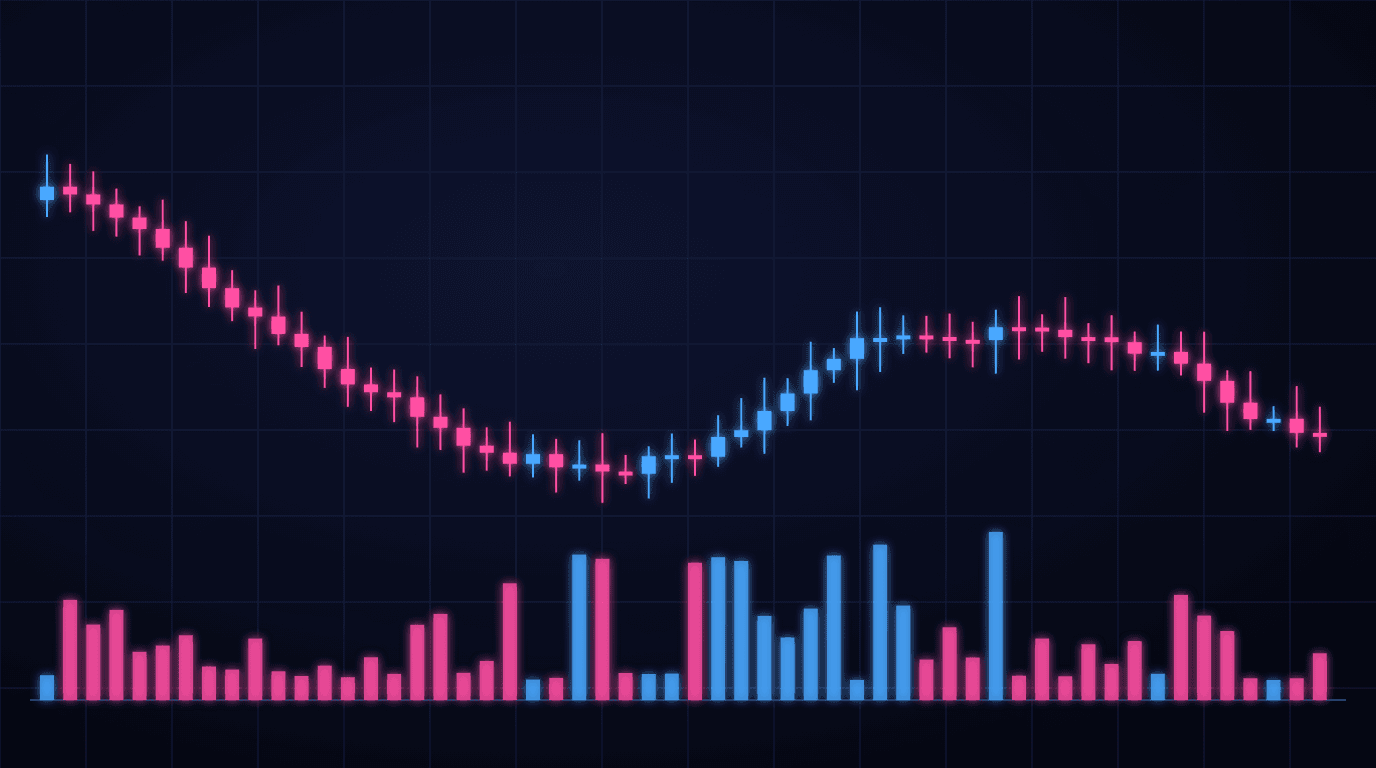
We often hear traders say a tick chart has volume built in, so the VOL indicator under it is wasted space. That's half right. A tick chart shows how busy the market is. It doesn't show how many contracts changed hands. Most of the confusion about tick chart volume sits in that gap.
What a tick is in NinjaTrader
NinjaTrader uses the word tick for two things. Its help guide says "a tick in a Tick bar represents the point at which an actual trade occurred." On a Range bar chart, a tick means something else: the smallest price step, which is 0.25 on ES.
So a Tick bar keeps building until it has the set number of trades, and the next trade starts a new bar. A 2000 tick bar closes after 2000 trades. The size of each trade plays no part.
What a tick chart does show
Every bar holds the same number of trades (the last bar of a session can be short), so the clock decides nothing. In our reading, this is what people mean when they say the volume is built in. A busy half hour prints many bars and a quiet one prints few, so counting bars is counting trades.
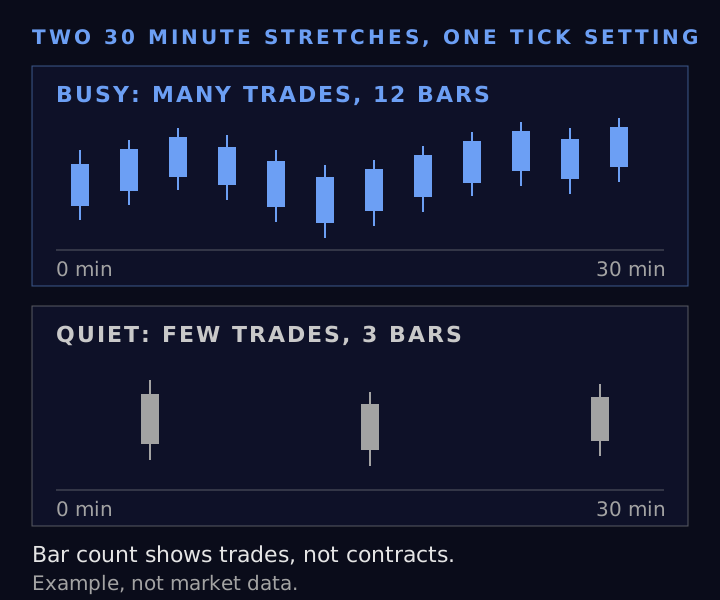
That count is worth having. On the charts we watch, bars often pack tight after the open and spread thin over the lunch hour, when trading goes quiet. Still, what you are reading is activity, not volume.
Where the volume hides
A single trade can be 1 contract or, for example, 100. NinjaTrader's own Block Volume indicator depends on that: it picks out trades that reach a size you set. A tick chart counts each of those trades once, whatever its size.
So two bars on the same tick chart can hold very different volume. The picture below uses example numbers, not market data. Both bars on a 5 tick chart hold 5 trades. One adds up to 6 contracts and the other to 69 contracts.
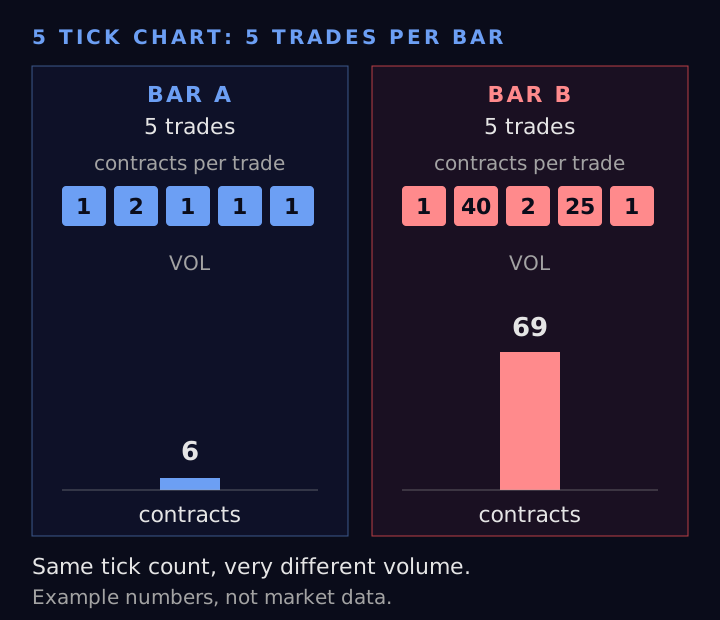
That's why the VOL indicator still earns its panel on a tick chart. NinjaTrader describes volume as the number of contracts traded, so under a tick chart the VOL bars rise and fall while every price bar holds the same trade count (again, the last bar of a session can be short). A tall VOL bar under an ordinary tick bar means the trades in it were larger on average.
Volume bars count contracts
NinjaTrader also has Volume bars. A Volume bar closes after a set number of units traded, which is contracts on a futures chart. The help guide shows a 10,000 Volume chart and checks it with the VOL indicator: each bar holds 10,000 contracts. The one exception it names is the last bar of a session, which can close short when the session ends. The Break at EOD setting controls that.
On a Volume chart, then, VOL is flat and says little. The bar count carries the information instead: more bars per hour means more contracts traded, however many trades it took. Each choice gives something up. A Volume chart hides the trade count, and a tick chart hides the trade size.
Which bar type answers which question
This split is our framing, built on NinjaTrader's definitions.
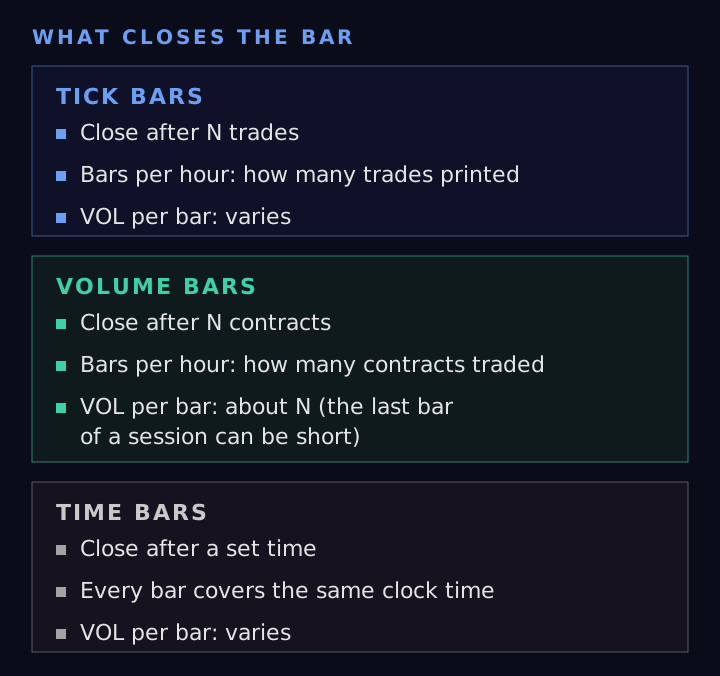
- How many trades printed: Tick bars.
- How many contracts traded: Volume bars, or the VOL indicator under any chart.
- What happened in each stretch of the clock: Time bars. Our tick charts vs time charts comparison covers that choice.
Why it matters across markets
In our reading, trade count and contract count drift furthest apart when two markets trade in different sizes, and ES and MES are the usual case: the same tick setting builds a different chart on each, largely because the mix of trade sizes differs. Our post on MES tick chart settings explains why no fixed MES number matches ES 2000 ticks.
Tick Chart Compare does that matching. It counts the bars on your chart and on a reference chart over the same time span and works out the interval that matches best. The reference chart can be any bar type, set with the Compare to Bar Type and Compare to Period settings.
Short answers
Does a tick chart show volume?
Not directly. It shows how many trades printed. Add the VOL indicator to see contracts.
Is tick volume the same as volume?
No. As we read the phrase, tick volume is a count of trades per bar. Volume in NinjaTrader's VOL indicator is the number of contracts.
Trading futures involves substantial risk of loss. Indicators are tools for reading the chart and do not promise any trading result.
Get the trading tool updates.
New releases, setup guides, and the occasional NinjaTrader tip. About once a week.