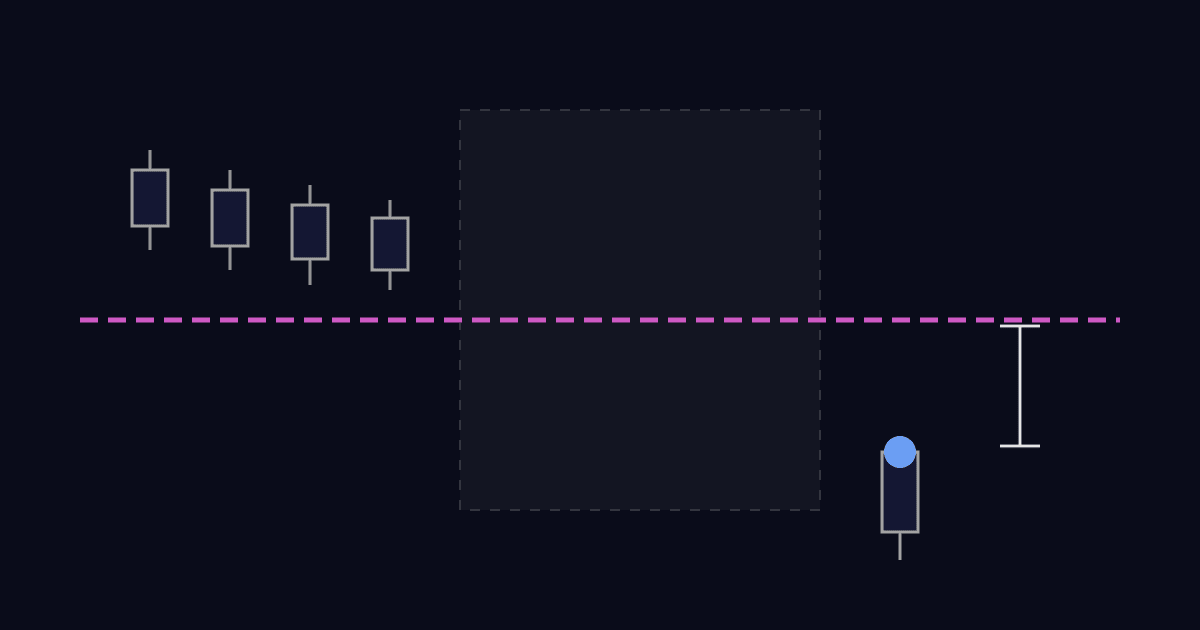
In September someone asked on the NinjaTrader forum about a stop that would not fill where it should. The topic title says the stop is recalculated every bar via SetStopLoss and shows a correct price in the Orders tab. The first post gives the numbers: the stop was submitted at 29,187.25, and the backtest filled it at 29,172.75. That is 58 ticks away, on a test set to 1 tick of slippage, with Order fill resolution set to High, Second, 1.
Two replies offered explanations, and both are worth checking. One of the replies was ours: we pointed at missing ticks, which would leave the fill engine with no prices for part of that day. The other reply pointed at the order: a stop that changes every bar has many prices over its life, and the one you are looking at may not be the one that was working when the fill happened.
Before either of them, rule out the setting people suspect first.
Slippage is not the cause
The help guide page Understanding Historical Fill Processing explains what Slippage does in a backtest. It is a number of ticks added to market, stop market and Market if touched fills, and it can never push a fill past the high or low of the next bar. Stop losses from SetStopLoss are stop market orders, according to the SetStopLoss() page, so the setting applies to them. One tick of slippage moves a fill one tick. It cannot make 58.
Cause one: High resolution needs tick data for that date
Under the default, Standard, NinjaTrader fills orders on the bars the strategy runs on. It splits each historical bar into three virtual bars and walks price from the open to the nearer extreme, then to the other extreme, then to the close. High lets you name a second, finer series that the fill engine uses as its price data instead. Both are described on Understanding Historical Fill Processing, and that page adds that the backtest starts only after the data for the strategy and the data for the fill series have both loaded.
The forum test used one second bars for that fill series. Where those bars come from is the part that matters. How Bars are Built lists the base data each bar type needs, and second bars are built from tick data. That page also notes that a provider without tick data cannot build tick, volume, range or second charts at all.
Our reading is that High, Second, 1 depends on tick data in practice. If a stretch of ticks is missing on the test day, there would be no second bars for that stretch, and the fill engine may have no price inside it to use. The stop would then fill at the first price after the gap, which can be a long way below the stop. The help guide does not spell that part out. It does say where the data comes from: Backtest a Strategy notes that by default the Strategy Analyzer downloads data from your market data provider, and that with Use Local Data Only enabled (right click the Strategy Analyzer, then Properties) it works from the data already in your database. With that option on, a gap in your stored ticks stays a gap.
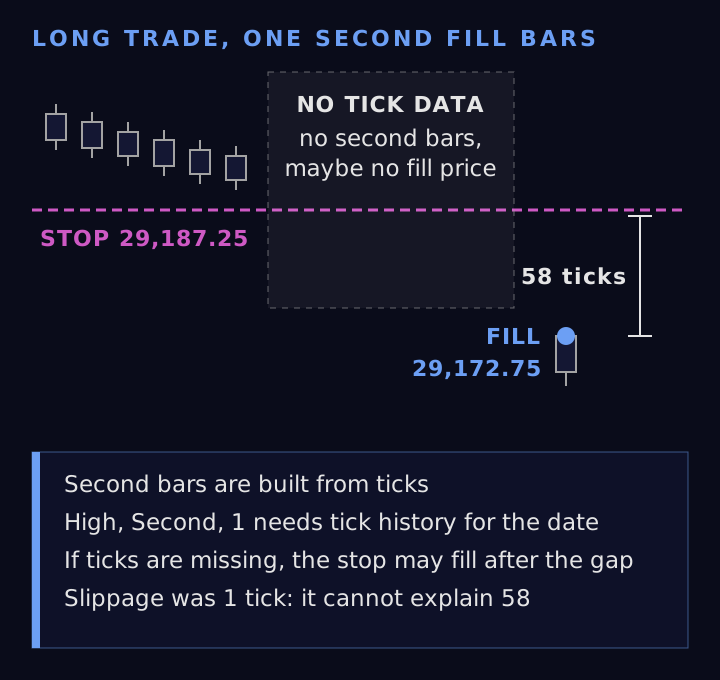
We have not seen the forum test's data, so treat this as the first thing to check, not the verdict. The check takes a couple of minutes:
- In Control Center, open Tools, then Historical Data. The Historical Data Window holds everything NinjaTrader has stored.
- In the Edit section, expand Historical, then the instrument, then Last, then Tick, and pick the date of the bad fill. The Editing page walks through the same steps. Look at the time of the fill and see whether ticks exist around it.
- If the day is thin or empty, the Download section can fetch it again, as long as your provider offers historical tick data for that range. Data by Provider has the table of which connections supply historical ticks. The Download page warns that asking for a range older than your provider offers can lose data you already stored for those dates, so keep the range to what the provider has.
- Run the backtest again and compare the fill.
The Strategy Analyzer can also put the fill on a chart. In the Executions display, right click the execution and choose Chart, and NinjaTrader opens a temporary chart at that spot. The Performance Displays page says that chart is a fixed 1 minute chart and needs historical data for the date. A 1 minute bar cannot show which price came first inside it, so use the chart to see where the fill sits on that bar and how far that is from the stop.
Cause two: the stop you see may not be the stop that filled
The second explanation is about the order itself. The SetStopLoss() page allows calling it from OnBarUpdate() to move the stop while a position is open. It also warns that if you do that, you should reset the stop when the strategy is flat, or the last value you set is used for the next position.
That warning is half of this cause. The page says that without a reset, the last price or offset value you set is used to generate the stop loss order on your next position. With CalculationMode.Price, the value is the stop price itself, so the next trade opens with the old stop from the trade before, and whether it sits above or below the new entry depends on where the price has gone since. In the offset modes, such as Ticks or Currency, the old offset is applied to the new entry instead. Check that your code resets the stop whenever the strategy is flat, before the next entry.
The other half is which revision you are comparing. A stop moved every bar is one order with many prices over its life. A single stop price on screen does not tell you which of them was working when the fill happened. The way to know is to log it. OnOrderUpdate() is called each time an order changes state, including a change in its price, and it hands you the stop price, the state and the time. OnExecutionUpdate() hands you the fill price and time. Line the two up and compare the fill with the last revision before it.
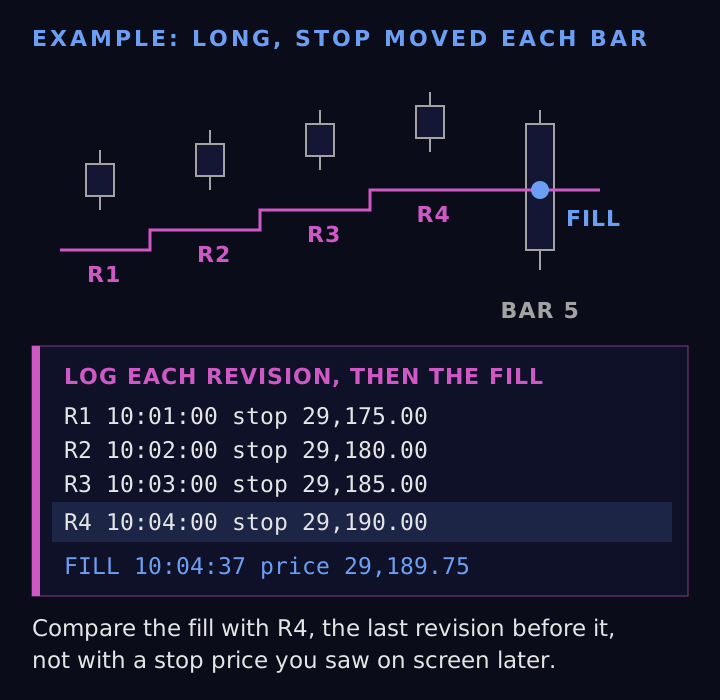
A minimal log looks like this:
protected override void OnOrderUpdate(Order order, double limitPrice, double stopPrice,
    int quantity, int filled, double averageFillPrice, OrderState orderState,
    DateTime time, ErrorCode error, string nativeError)
{
    if (order.Name == "Stop loss")
        Print(time + " revision  stop " + stopPrice + "  state " + orderState);
}

protected override void OnExecutionUpdate(Execution execution, string executionId,
    double price, int quantity, MarketPosition marketPosition, string orderId, DateTime time)
{
    if (execution.Order.Name == "Stop loss")
        Print(time + " fill  price " + price);
}
The SetStopLoss() page gives "Stop loss" as the signal name the method creates, which is why the filter uses it. Match on that name and the times. Do not match on the order id: the Order page says OrderId is not a unique value and can change during an order's life.
One more test tells the two causes apart. Run the same bars twice with the same fill settings, once with the stop moving every bar and once with a fixed stop. If the fixed stop fills where you expect and the moving one does not, look at the revisions. If both fill far away on the same day, look at the data.
While you are in the code, check the isSimulatedStop argument too. The SetStopLoss() page says a simulated stop is held locally and sent as a market order once triggered. Test with the value your strategy will use, then with the other one.
A related question: two runs on two fill models
A second forum thread asked a related question. A strategy was optimized in the Strategy Analyzer with High order fill resolution on 1 tick. The chosen settings were then run on a chart with Tick Replay on, and the results did not match.
Two notes in the help guide explain why they could not. Understanding Historical Fill Processing says Order fill resolution cannot be used with multi time frame or multi instrument strategies, or when Tick Replay is used. Tick Replay says it is not intended to function in strategy backtests, and that High fill resolution in the Strategy Analyzer is one way to get finer fills in a backtest. The optimization filled orders on a 1 tick series. The chart run did not use that model at all.
For the cases where Order fill resolution is off the table, the first page gives the answer: write the strategy so it submits its orders to a single tick data series. NinjaTrader ships a reference sample for this, Backtesting NinjaScript Strategies with an intrabar granularity. It finds its conditions on the primary bars and sends the orders to a finer series it adds itself. Because the fill series is in the code, it is the same series wherever the strategy runs. One catch if your stop comes from SetStopLoss: the SetStopLoss() page says that with several Bars objects of the same instrument, you should submit orders for that instrument only to the first Bars context. A stop meant for the added 1 tick series has to be an explicit exit order instead, using the advanced overload of ExitLongStopMarket(): ExitLongStopMarket(int barsInProgressIndex, bool isLiveUntilCancelled, int quantity, double stopPrice, string signalName, string fromEntrySignal), with the barsInProgressIndex of that series. Call it with isLiveUntilCancelled set to true, or submit the stop again on every bar of that 1 tick series (BarsInProgress 1 when it is the first series you add). The Managed Approach page says orders from the Entry() and Exit() methods cancel at the end of a bar if they are not submitted again, and the ExitLongStopMarket() page says that with isLiveUntilCancelled the order will not expire at the end of a bar. On a 1 tick series each bar is one tick, so a stop that is not kept live would last a single tick.
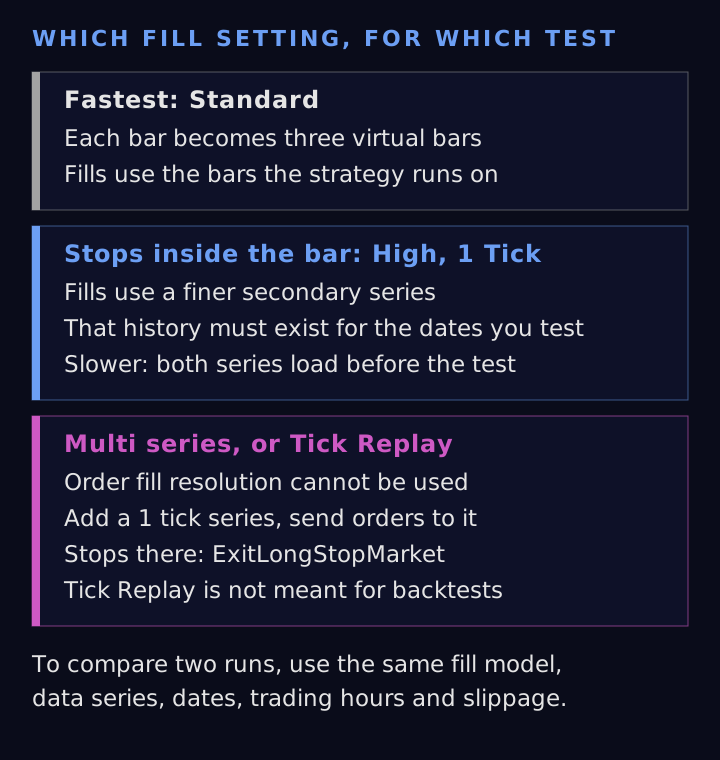
Even with the same fill model, two runs only agree when everything around it matches: the same data series, the same dates, the same trading hours template, and the same slippage and commission settings. The Backtest a Strategy page lists all of these properties in one place, which makes it a useful checklist. It also says some difference between real time and backtest results is to be expected.
A short checklist for a stop that filled too far away
- Rule out slippage. It is capped at the next bar's high or low and cannot add dozens of ticks.
- If Order fill resolution is High, open Historical Data and confirm the fill series has data for the date and time of the bad fill. For second or tick fill series, that means tick data.
- Open the fill on the temporary chart from the Executions display and see where the fill sits on that bar.
- If the stop moves every bar, log every revision with OnOrderUpdate and the fill with OnExecutionUpdate. Compare the fill with the last revision before it.
- Make sure the strategy resets its stop when flat.
- When two runs disagree, check that they use the same fill model. A Tick Replay chart and a High resolution backtest do not.
As of November 9, the thread had no accepted answer. If you hit the same gap and the checklist does not explain it, send us the details through the contact page.
Futures trading involves substantial risk of loss and is not appropriate for all investors. A backtest shows how a strategy would have filled on stored data; it does not predict live results.
Get the trading tool updates.
New releases, setup guides, and the occasional NinjaTrader tip. About once a week.