A measured move says the next leg will run as far as the last one. We checked that on a year of ES data before we drew it in our own indicator. The second leg was usually shorter, and price did not turn at the measured move target any more often than at levels a little before or past it. We draw the target anyway, because even a level you do not trust tells you whether a trade has room.
What a measured move is
A trend moves in legs. Price runs, pulls back, and then often runs again. A measured move takes the size of the first leg and copies it onto the second one, starting from the end of the pullback.
For a move up:
- Leg 1. Measure from the low where the leg started to the high where it ended.
- The pullback. Wait for price to pull back and turn up again. Note the pullback low.
- The target. Add the size of leg 1 to the pullback low.
An example with round numbers on ES: leg 1 runs from 5400 to 5420, so it is 20 points. Price pulls back to 5410 and turns up. The measured move target is 5410 plus 20, which is 5430. For a move down, flip it: subtract the leg from the pullback high.
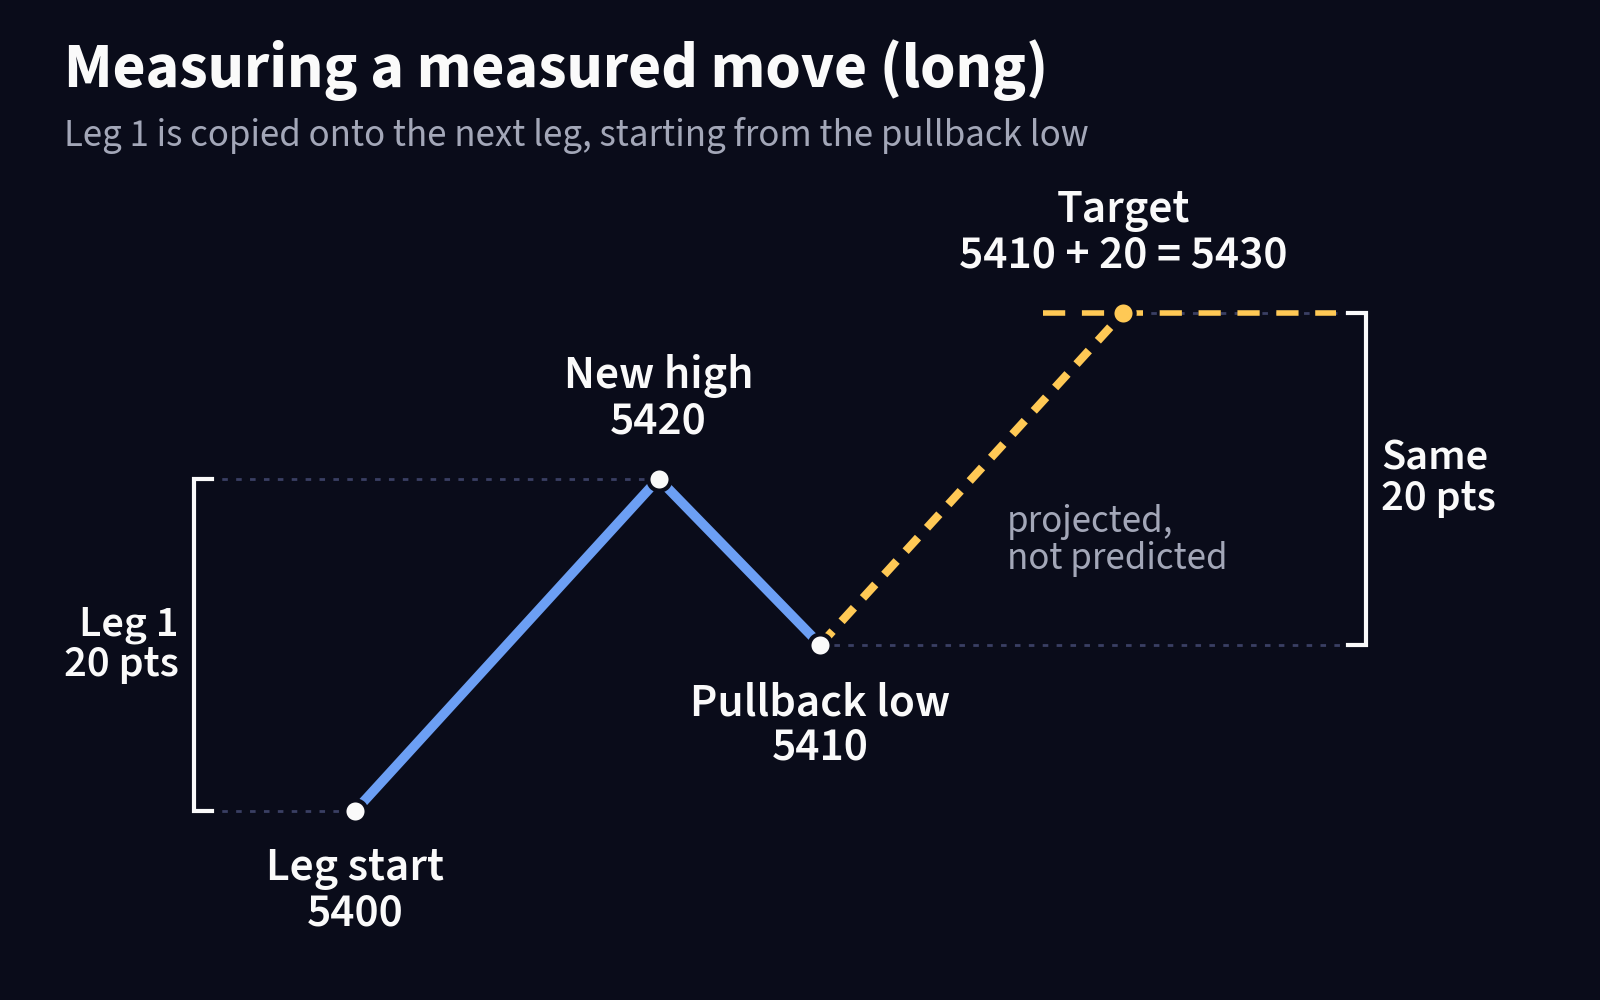
Measure leg 1 from its start to the new high, then add the same size to the pullback low. The target is a projection only.
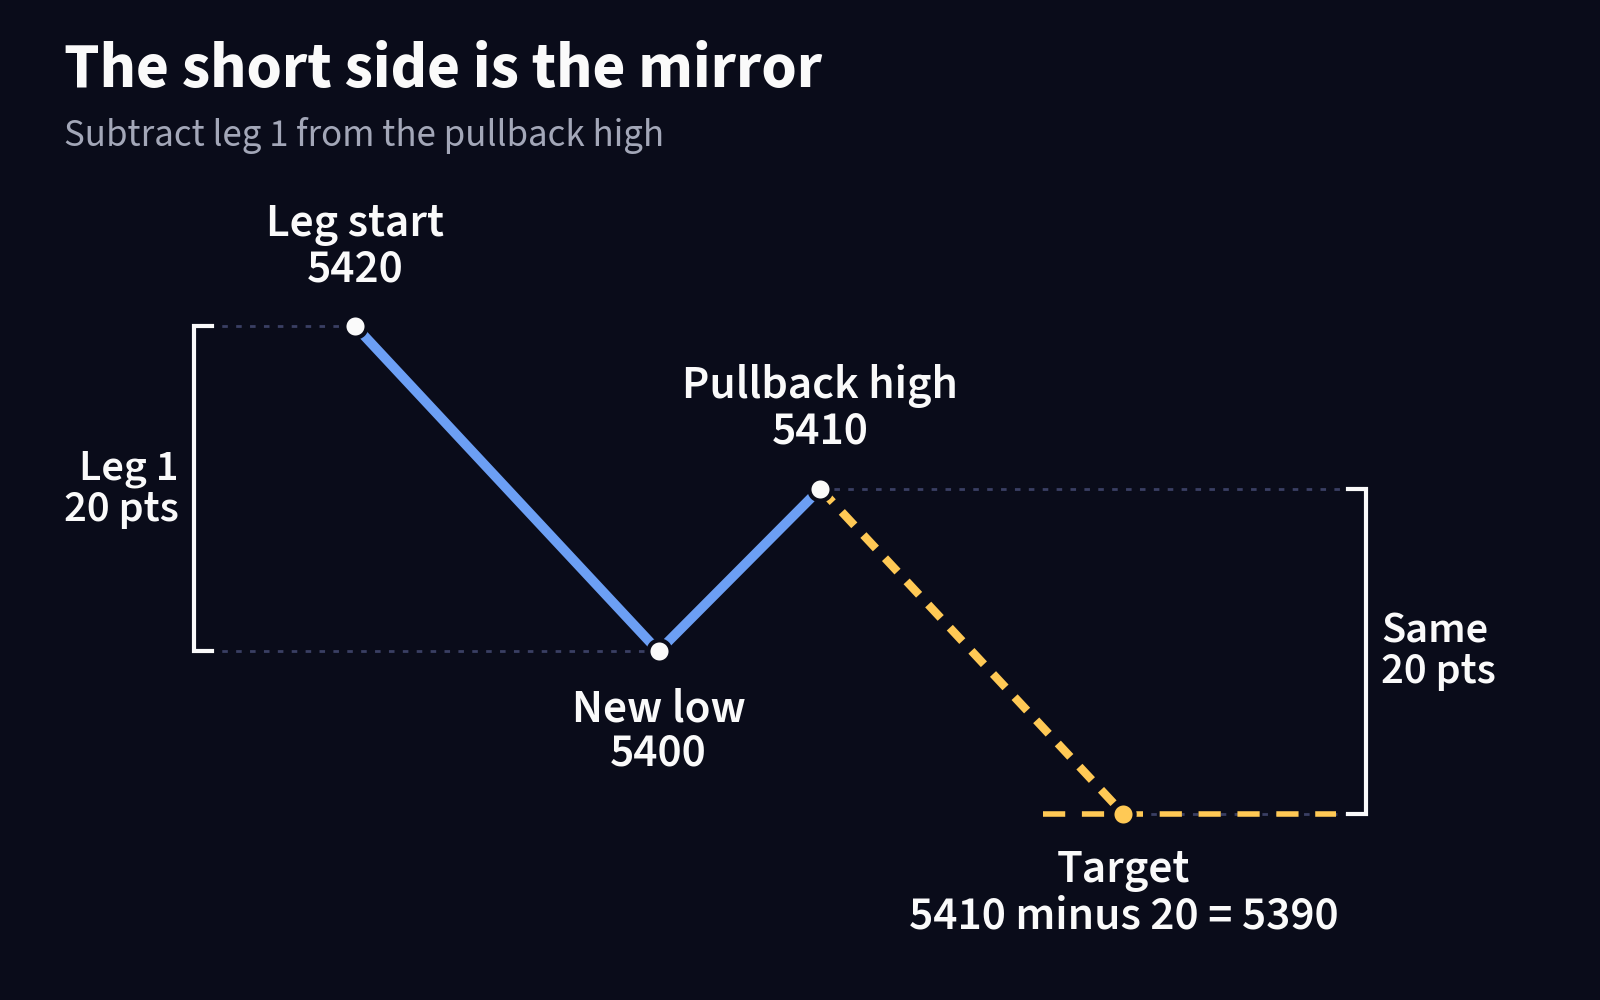
For a move down, subtract leg 1 from the pullback high.
One case has no target at all. If the pullback goes past the start of leg 1 (below 5400 in the example), the pullback has taken back the whole leg, so there is nothing left to measure.
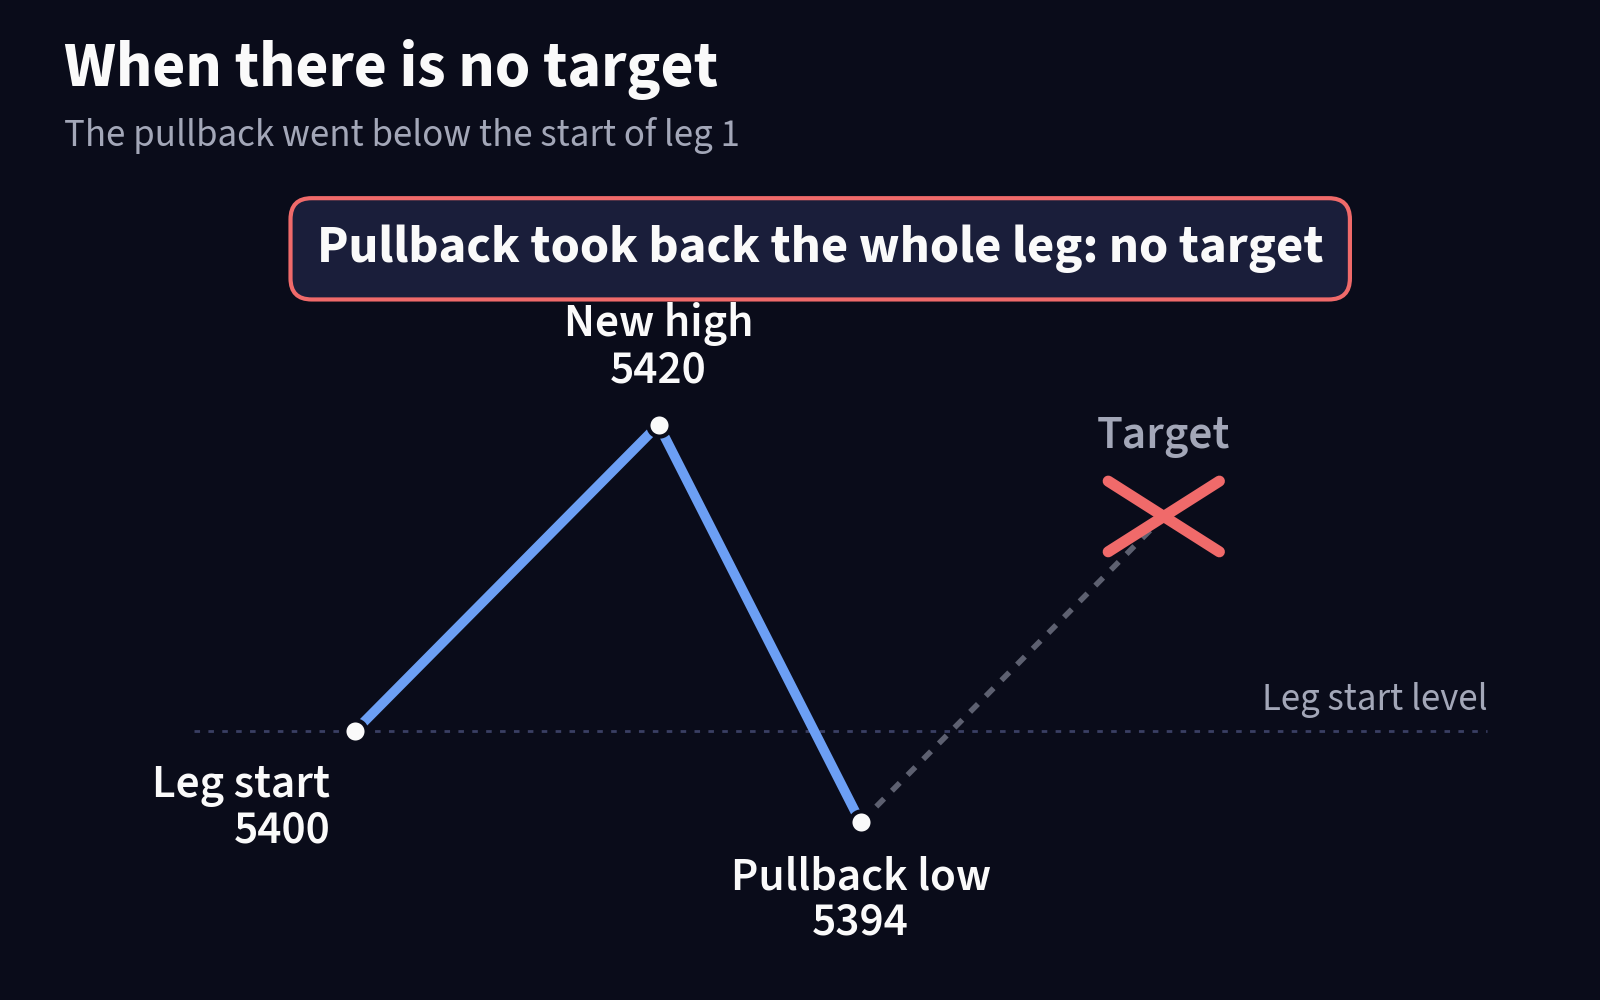
If the pullback goes past the start of leg 1, there is no leg left to measure, so there is no target.
How traders measure it
The classic sources agree on the arithmetic and differ on the details. The harmonic AB=CD pattern names the points. "The A to B leg is the first price move", then price retraces from B to C, and "the C to D leg ... is the same length as AB." Harmonic traders want C between 38.2% and 88.6% of AB, and they also use longer versions where CD is 1.27 or 1.618 times AB.
Thomas Bulkowski, who catalogued chart patterns at thepatternsite.com, measures the first leg "from the lowest valley" to "the highest peak at the start of the corrective phase" and adds it "to the lowest valley in the corrective phase (point C)." He also scales the leg down before adding it, and notes: "Reality shows the pattern falls short of expectations."
LuxAlgo writes it as a formula, target = C + (B minus A), and adds that "symmetry between legs is a tendency, not a rule." Their indicator drops the setup when the pullback goes too far: "A correction retracing the entire first leg voids the construction."
So all three measure the leg on highs and lows and project from the pullback extreme (point C). None of them project from your entry price or your fill. Where they part ways is which leg to measure in a long trend, and whether to use a multiple other than one.
What our ES tests found
We ran a rough research test on ES futures in September 2026. We used 2000 tick bars from 12 sessions (May to September 2026), 1 minute bars of regular trading hours from April 2025 to April 2026, and 5 minute bars built from the same 1 minute data. On 1 and 5 minute bars we kept the last three months apart as an out of sample check. The legs and pullbacks came from second entries, the same setups our indicator marks: 567 on 2000 tick and more than 10,000 on 1 minute. We did not include commissions or slippage. This tests the level only; we did not test a trading system built on it.
The second leg was usually shorter than the first. We measured how far price ran from the pullback before it came back through the pullback extreme. With our default rule the median second leg was 0.58 to 0.68 of the first leg, depending on the bar type and the sample.
If price respected the measured move, many second legs would end close to the full leg size. Ours did not bunch up there. The share that ended near one full leg was the same as when we shuffled legs at random between setups of similar volatility.
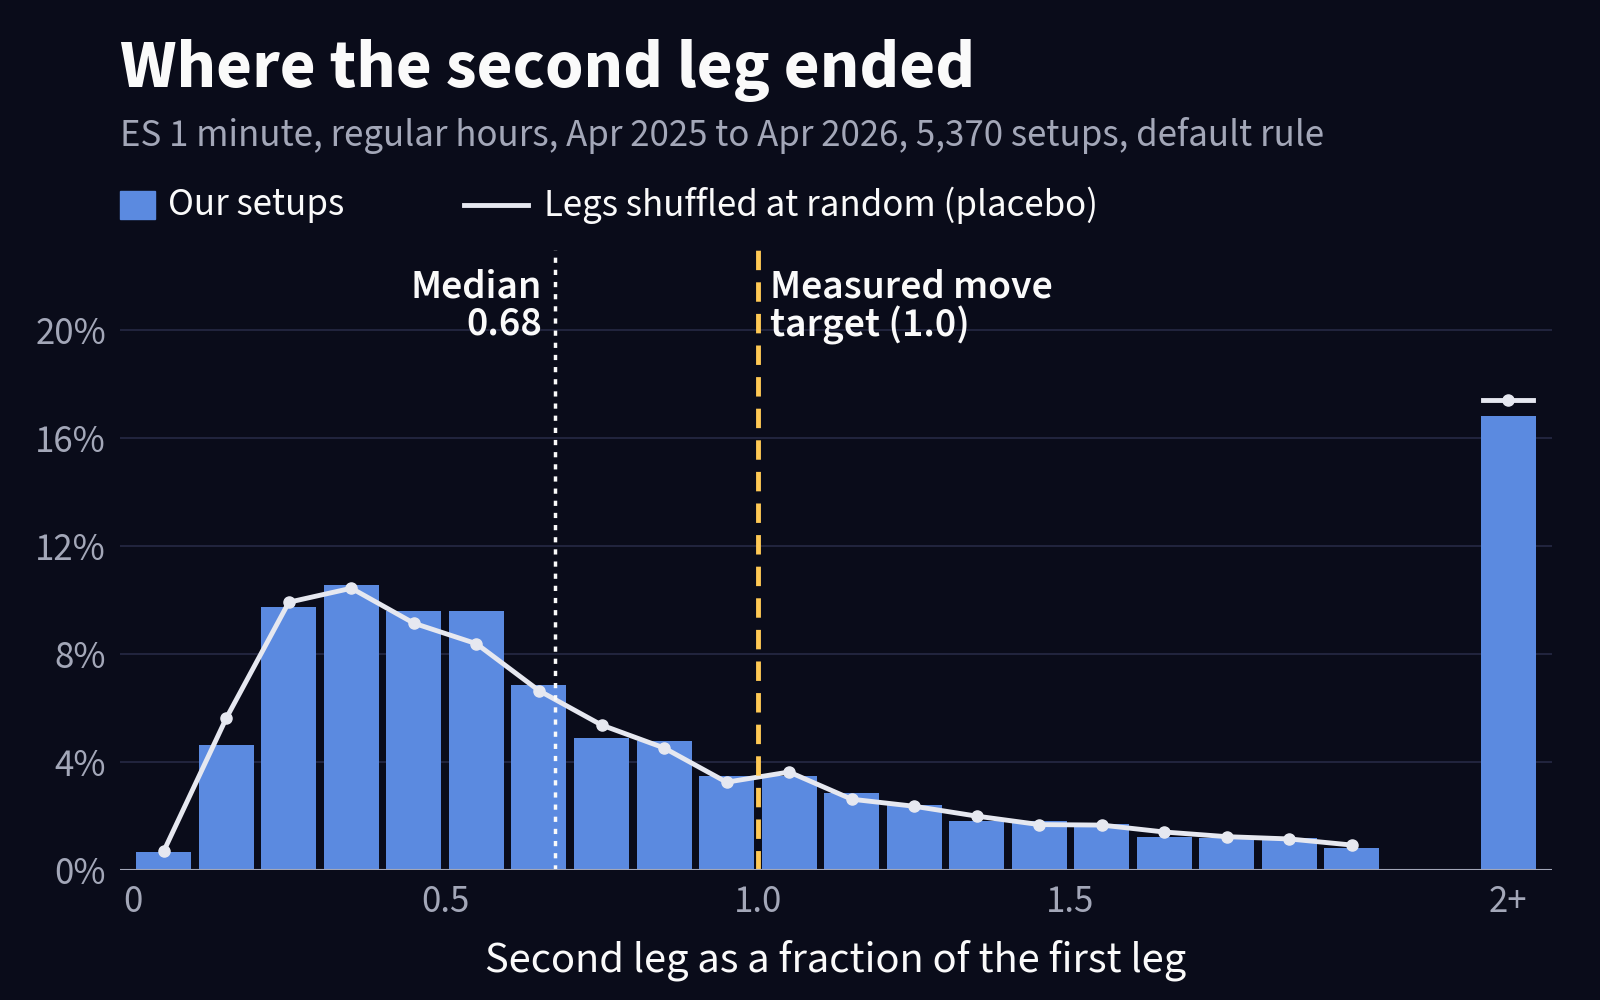
Most second legs ended before the measured move target, and the shape matches legs shuffled at random. ES 1 minute bars, regular hours, April 2025 to April 2026, default rule, no costs. The last bar collects every leg that ran two times the first leg or more.
"How often does price reach the target" has two answers, and they count different things.
In one move, about 1 in 3 second legs reached or passed the target before price came back through the pullback low (the pullback high for a short): 35% of 5,370 on 1 minute bars, 30% of 1,116 on 5 minute bars and 33% of 299 on 2000 tick bars. The other 2 in 3 stopped short. Legs that did reach the target mostly kept going; on 1 minute bars, 32% of all second legs ran at least 10% past it.
Given more time, about 60% of targets were reached within 100 bars (59.5% on 2000 tick, 62.9% on 1 minute), often in a later move after a dip. This second number is the one to compare with other published studies, because they also count with no stop.
About 1 in 6 second legs (902 of 5,370, the 2+ bar in the chart) ran twice the first leg or more, so most legs stopped short but some ran much further, and the target is not a reason to cap every trade.
Price did not react at the target either. We counted how often price turned back from the target, and from levels 25% nearer and 25% farther. Price did not turn at the target more than at those levels, in any sample.
Stricter rules did not change any of this. We tried limits on pullback depth, a minimum leg size, a trend filter, and mixes of all three. They cut the number of targets a lot (on 1 minute bars, from about 25 a day to about 8), but the medians stayed between 0.46 and 0.77, and the target still drew no special reaction. Keeping only deep pullbacks, which Bulkowski's own scan favors, gave medians of 0.76 to 0.86, which is closer to one but still short of it.
First entries looked the same. Measuring from the first pullback instead of the second gave medians of 0.55 to 0.70 and no reaction at the target.
We only tested ES, on one year of data, so another market or another way of picking the leg could behave differently. We have not tested that.
How our numbers compare with other studies
Other published studies of hand picked measured moves report that about 60% of upward patterns and about 43% of downward ones reached the target. They count with no stop and no time limit.
Counted a similar way (no stop, within 100 bars), about 60% of the targets WiSE drew on ES were reached, as above, so our result is in line with theirs. Put a normal stop just beyond the signal bar and the picture changes: only about 30% reached the target before the stop. That is about what chance gives for a level that far away. A hit rate on its own says little until you set it against the distance to the target.
Other studies also find that the second leg tends to be a bit shorter than the first. Ours ran 0.58 to 0.68 of it.
Many traders say the measured move works best in a trending market and poorly in a trading range. We tried a simple trend filter: only setups in the direction of a 21 bar average, with price on the right side of it. Targets were reached slightly more often and the second leg ran a little further, but the difference was small enough to be luck. A trend may help a little. Our data cannot prove it.
Measured move trading: use the level to plan
A target that price does not respect can still be useful. It turns the chart into a number you can plan with before you enter.
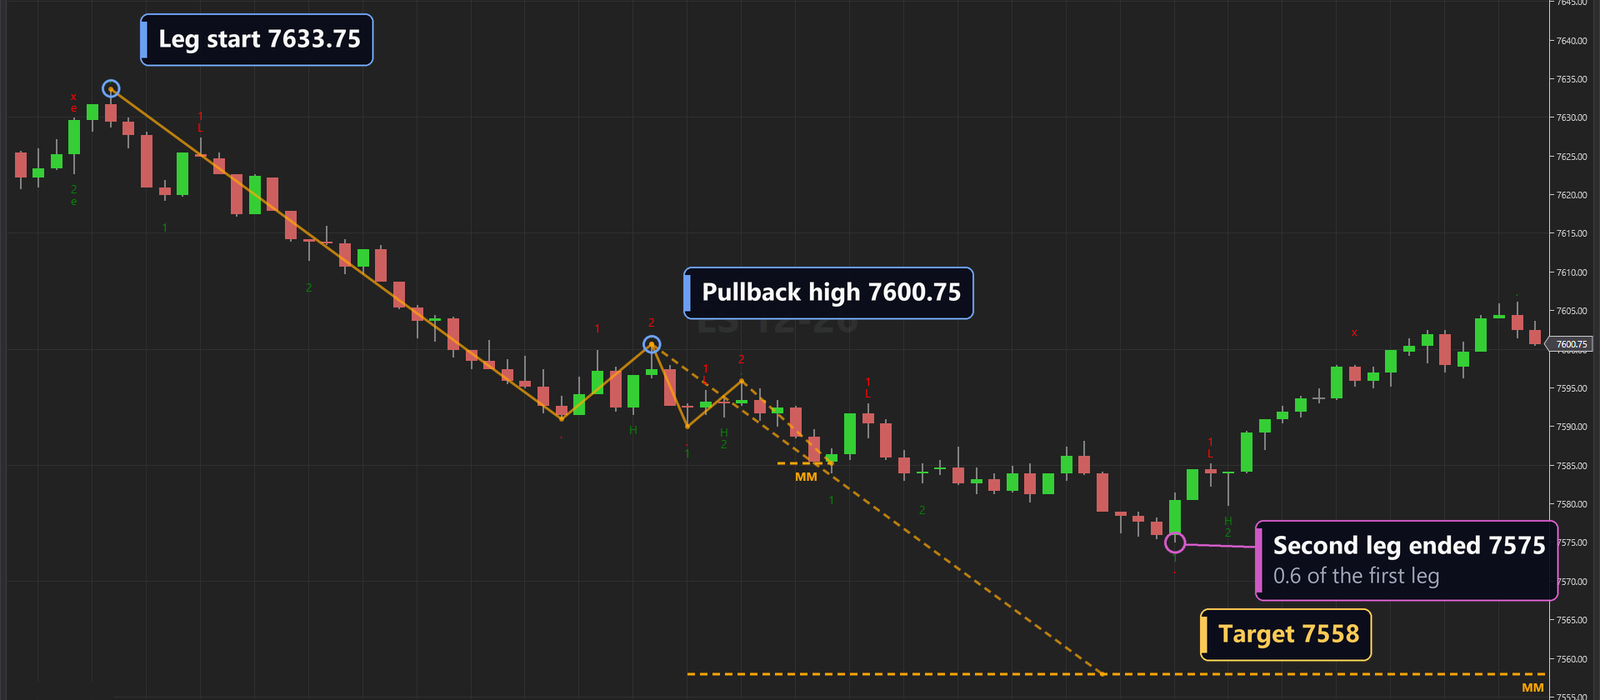
A short on ES, Sep 16: the target was 7558, but the second leg ended at 7575, about 0.6 of the first leg. The small MM line near 7585 belongs to a later, smaller setup.
Start with the room. If the measured move target sits barely further away than your stop, the trade has little room even if the leg repeats in full. Some traders pass on those, and the cost is that they skip some trades that run anyway.
The leg that sets the target is the same structure that sets your entry and your stop, so size the trade from it and the whole plan stays in one frame. Decide before the trade what you will do near the target: take part off, trail, or hold. That choice is easier to make while price is not moving.
Project from the pullback, not from your fill. Then the level depends on structure only, and two traders looking at the same chart get the same number. And when the pullback took back the whole leg, there is no measured move, so skip the setup instead of forcing one.
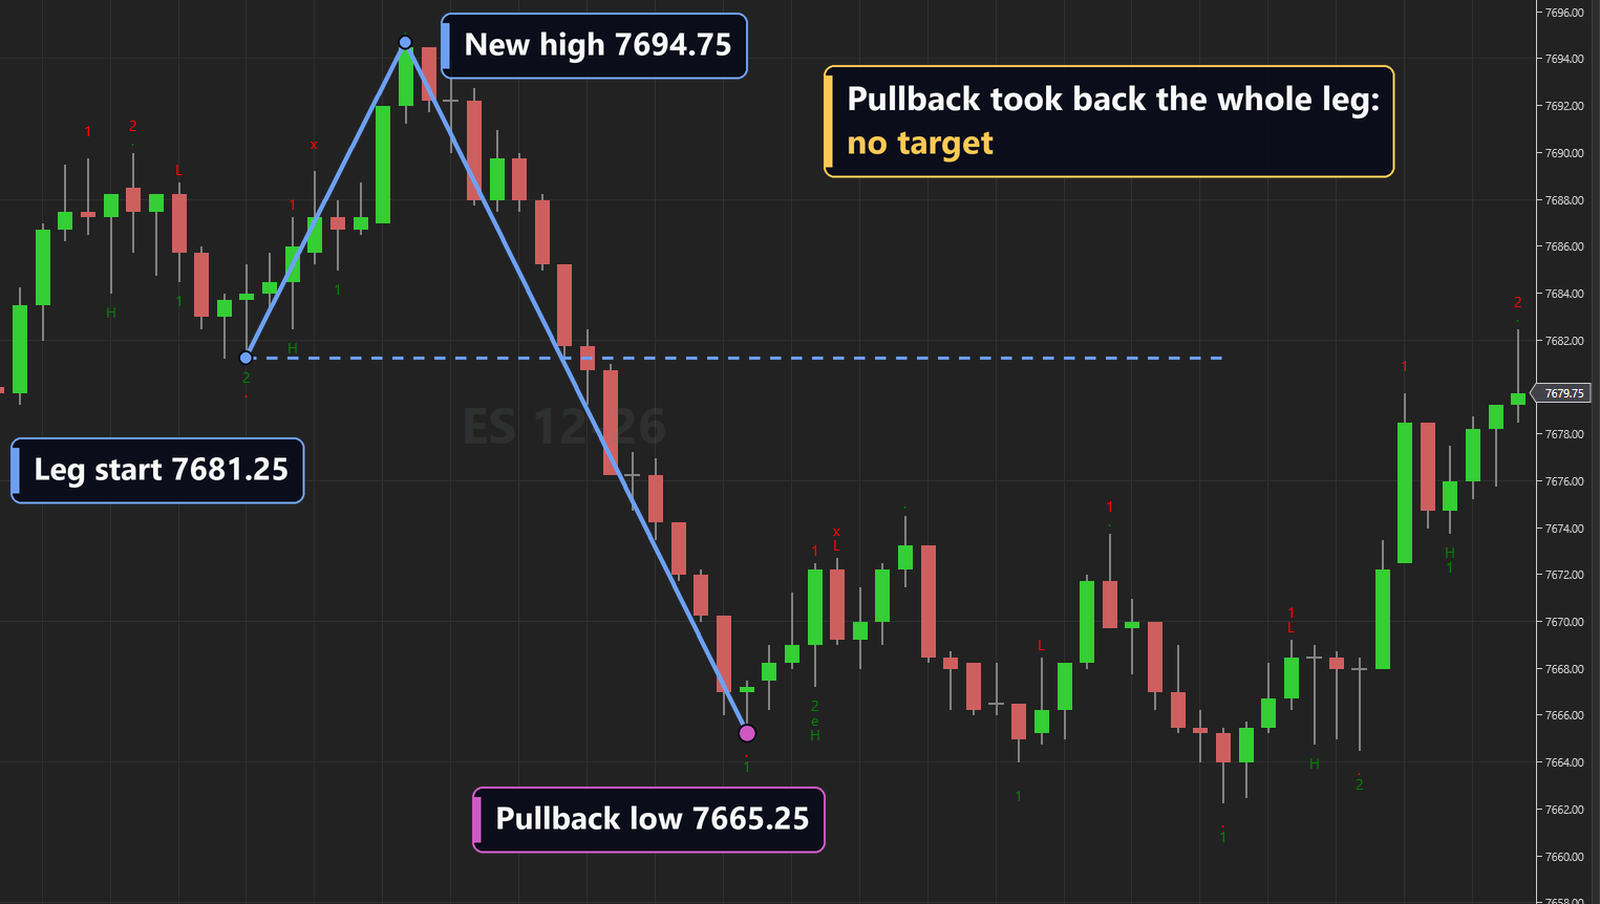
A long on ES, Sep 14: the pullback went below where the leg started, so there is nothing left to measure and WiSE draws no target. The lines and labels were added afterwards to mark the points.
How WiSE draws it
WiSE, our second entry indicator, draws the measured move target on its second entries from 2.04.0 on. It measures the leg from the same swings it uses to call the entry, so the target and the signal come from one count. A zigzag shows the leg, the pullback and the projection, and a dashed MM line marks the target. When the pullback goes past the start of the leg, WiSE draws no target.
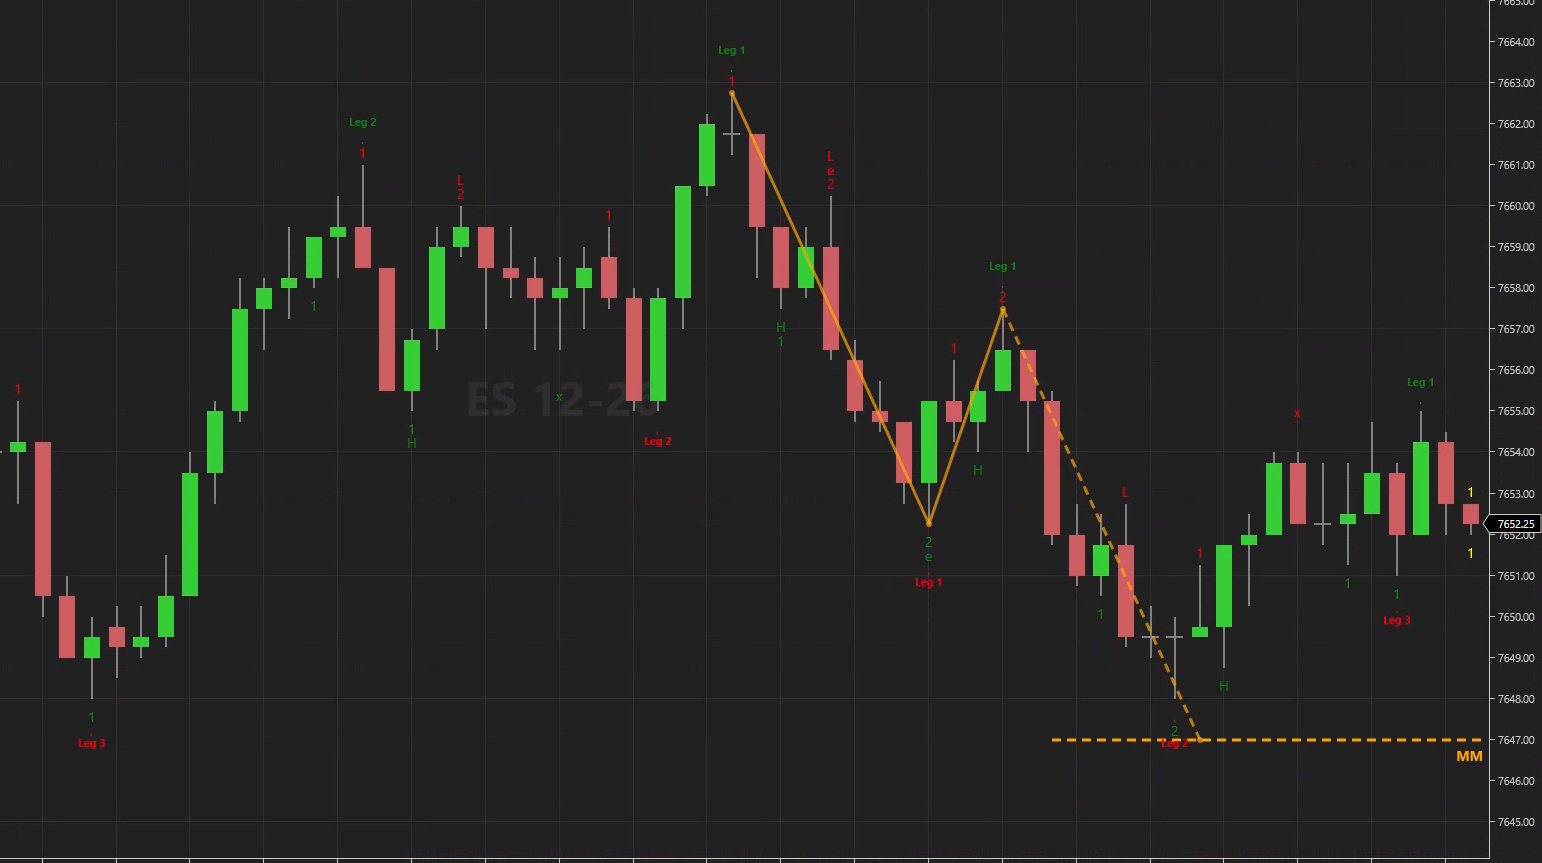
One example on ES: a short second entry. We picked it because it is easy to read. It is not typical: most targets do not end this cleanly.
Everything else in the release is in What WiSE 2.04.0 adds. The exact rules for the target are in Understanding signals, and every setting is in the Settings reference.
Get the trading tool updates.
New releases, setup guides, and the occasional NinjaTrader tip. Roughly once a month.